Explore x86-64 executables with ASM Editor
Inspect executable instructions, bytes, registers, and memory in ASM Editor's browser debugger, with an example project to try.
A browser workspace for executable inspection
ASM Editor lets you open an x86-64 executable, inspect its instructions, and debug it in your browser. Its built-in Ghidra decompiler also provides a C-like view of a function. You can follow a program's behavior through its code, registers, memory, flags, and terminal output.
This makes the workspace useful for exploring compiled programs and small reverse-engineering exercises. You can open the example at the end directly in the editor.
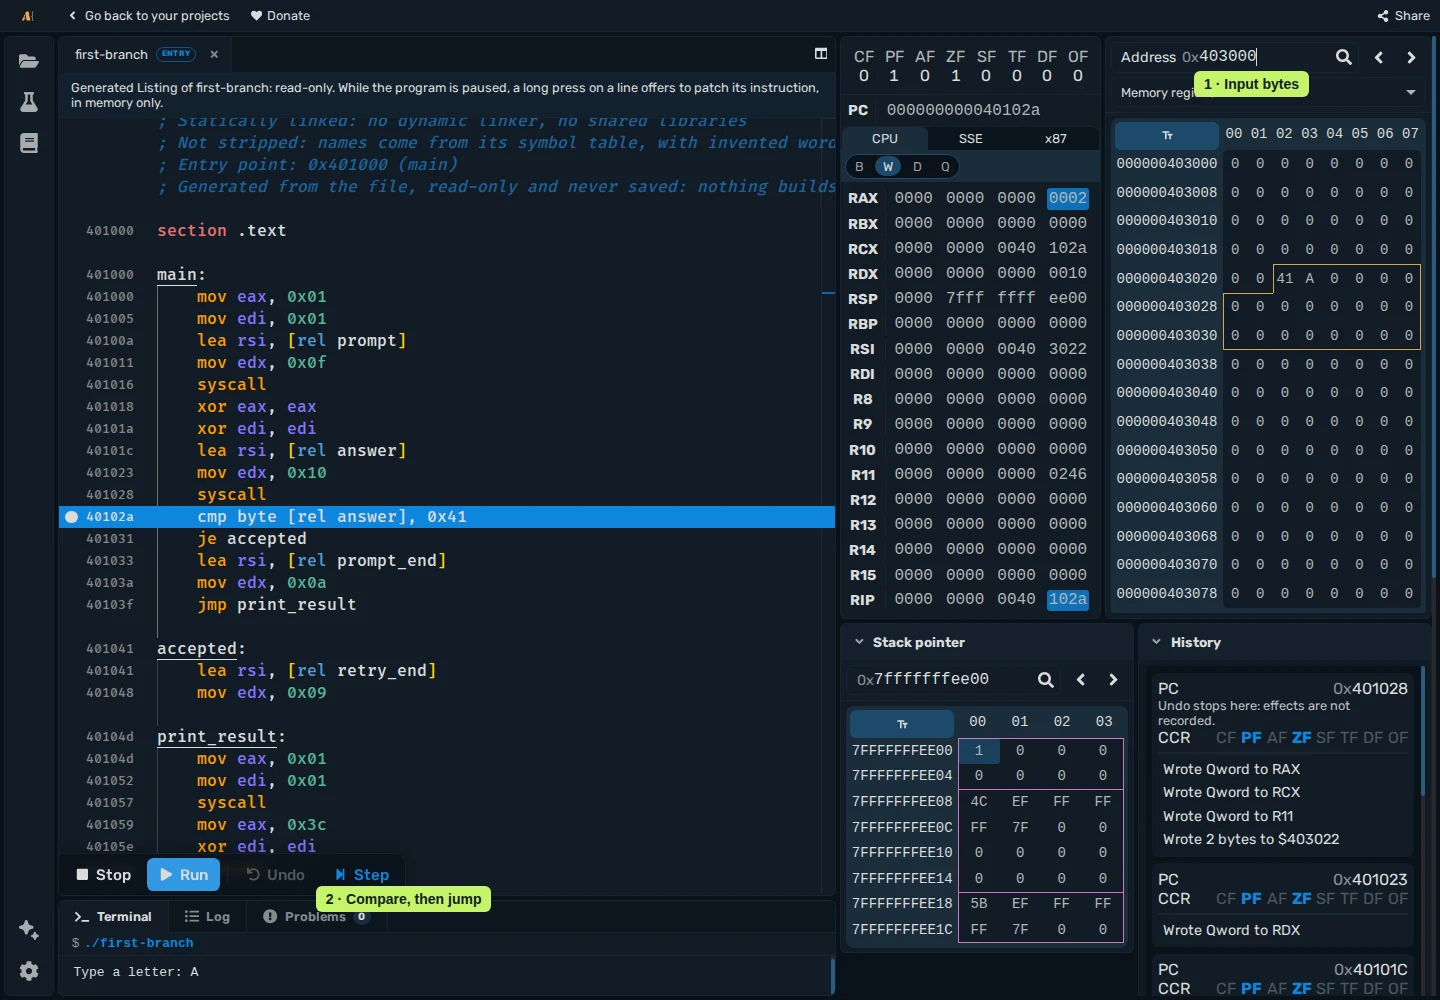
Import and inspect a program
Open Projects, choose Import, and select an x86-64 Linux ELF executable. ELF is the file format used for Linux programs and libraries. ASM Editor recognizes the file's contents and creates an x86 project with it as the entry file.
The executable opens as a Listing, showing readable assembly instructions with their addresses and bytes. Disassembly decodes the program's machine instructions into this assembly view.
In an existing x86 project, upload an executable through the file explorer to inspect it.
Read a function as Pseudocode
Ghidra's decompiler reconstructs function calls, conditions, and loops from machine code, displaying them as Pseudocode that resembles C. It runs in your browser, so you do not need to install Ghidra.
Place the cursor inside a function in the Listing, then choose Decompile in the controls below the editor. The Pseudocode opens beside the Listing. Moving the Listing cursor to another function updates the Pseudocode to show that function.
Related lines connect the Pseudocode to the assembly instructions that implement them. Select lines in either pane to highlight the corresponding lines in the other.
Pseudocode is an approximation made from the executable, not the original source. It is intended for reading and is not meant to compile. The decompilation reference explains the view in more detail.
Find a practice flag
Download the practice executable, then open Projects, choose Import, and select the downloaded file. Choose Decompile in the controls below the editor. The example project at the end of this post opens the same executable without a download.
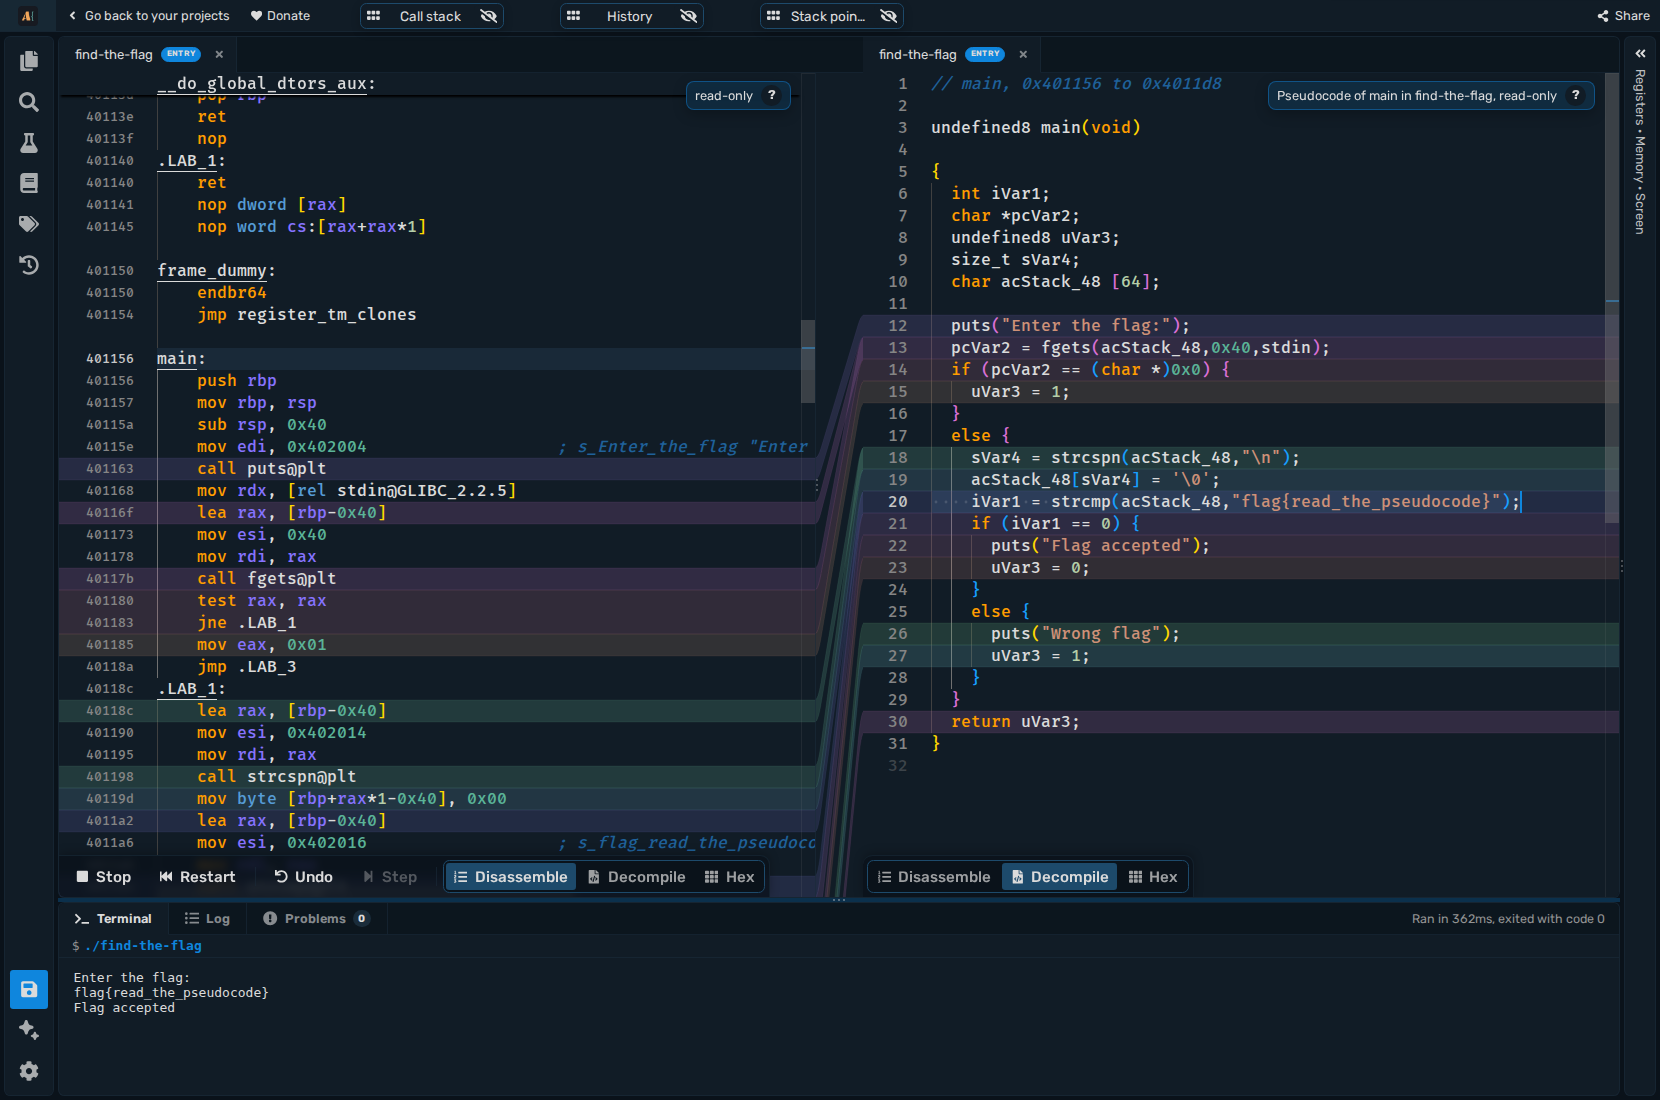
The Pseudocode calls strcmp to compare the entered text with flag{read_the_pseudocode}. strcmp returns zero when the strings match. The if (iVar1 == 0) branch then prints Flag accepted, revealing which input to try.
Choose Debug, then Run. Enter flag{read_the_pseudocode} in the Terminal and press Enter. The message Flag accepted confirms that the discovered text passes the check.
The C source is available for comparison or rebuilding.
Debug without the original source
Debug loads the executable and advances through startup toward its detected main, or its entry point when no main is found. Run continues execution.
- Breakpoints pause execution before a chosen instruction. Click the margin beside an instruction in the Listing to place one.
- Step follows execution while registers, memory, flags, and execution history show the current state.
- Undo revisits recorded execution states.
- Call stack entries let you navigate the program's recorded calls.
The Listing is a view of the executable's machine code. Debug loads the executable itself.
Connect instructions, data, and output
Search the Listing for a message, function, or instruction. Named locations and Go to References help you find the code that uses them. The editor supplies names for locations that have no original symbol name.
While paused, inspect the same program's bytes in Memory and its values in Registers. This keeps a branch, the data it reads, and the resulting terminal output visible within one workspace.
You can also patch an instruction while paused. The patch preview shows the replacement before applying it. A patch changes the running program's memory; the next Debug reloads the executable's file bytes. The executable reference explains patching and its Undo limits.
Supported executables and libraries
The simulator accepts x86-64 Linux ELF executables, including static, position-independent, and supported dynamically linked programs. Dynamically linked programs can use the editor's bundled Linux libraries.
The executable reference lists supported formats, libraries, startup behavior, and environment limits.
For programs you write yourself, ASM Editor also supports C/C++ compilation and assembly projects in the same workspace.
Try ASM Editor
The example project below contains the flag executable from above and two testcases: the flag prints Flag accepted, and any other input prints Wrong flag.
Open it with Try ASM Editor, then choose Decompile to read main as Pseudocode. Choose Debug and Run, enter a guess in the Terminal, and press Enter. Use Stop and Debug for a fresh run with another input, or choose Test to check both prepared cases.
To explore the debugger, set a breakpoint beside the test eax, eax instruction that follows the call to strcmp in the Listing, then run and enter a guess. When execution pauses there, eax holds the result of strcmp, zero only for the flag. Step to follow the jne to the message it chooses.